Viewing Data
The dataset we are using today is a somewhat fake list of my dog Charlie’s favorite treats (I didn’t actually look up prices, just estimated). We’ll use it to answer some practical questions and show you how to do things you would do in Excel or Google Sheets in R.
For reference, here is Charlie with one of his treats:

Now we have the data loaded in and stored as an object called treats, you can examine your data. The simplest way is to click on the object name in the Variable Environment (not the drop down arrow, the name). This should open treats in another window and it should look like an Excel or Google Sheets spreadsheet.

Note that clicking the name is the same as running the View() command.
View(treats)One significant way this is different than an Excel spreadsheet is that you cannot edit the data directly. Any changes you make must be in the code. This might seem annoying, but the first time you realize you overwrote data that you actually need, you’ll be happy that the original is still there.
Another way to inspect the data is to see an overview of what the columns are and how R is interpreting the data in each—does R think your data is a character or a number? To do this we use the glimpse() command:
You should see output that tells you the data has 31 rows and 8 columns. The names of each column are printed and next to that in <> it tells you if that data is a character (chr) or a number (dbl). It also shows some of the first values in each column.
If you wanted to look at just the names of all columns we can use another function called colnames() to print out all the columns. Try it below, you’ll just need to add the dataset name inside the parentheses.
View Individual Cells or Columns
If you want to access the data in the spreadsheet, there are a number of different ways.
First, let’s say you want to look at the value of a single cell. You do this by referencing the name of the dataset (which in R speak we now call a data frame or a tibble) and the row and column number inside []. If you want to view everything in a row or column, you just leave the number blank
Another way to look at all the data in a column is to say the name of the dataset followed by $ then the column name. Note again that the column name must be spelled exactly as it appears in the data, including capitalization.
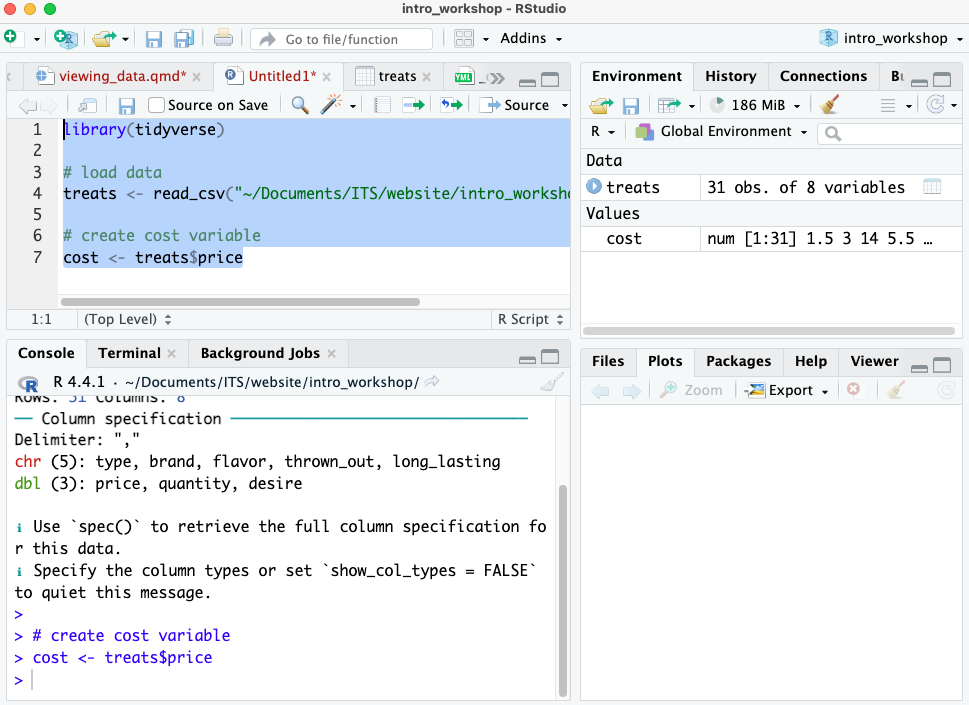
If we wanted to make one of those columns into its own object for some reason we could make up a name and store the column as that name. Let’s say we want to get just a list of all the prices as the variable object cost, we would type:
Note that in RStudio, you will now see cost appear in the top right Variable Environment panel. However, in this doc, when you run that code nothing will happen. You have saved it, but you haven’t displayed it, so no output will appear. The same is true for the console in RStudio. You will see the cost line appear in blue, but you won’t see the numbers print to the console.

If you want to print cost out, you can add another line that just says cost below the line where we created it.